
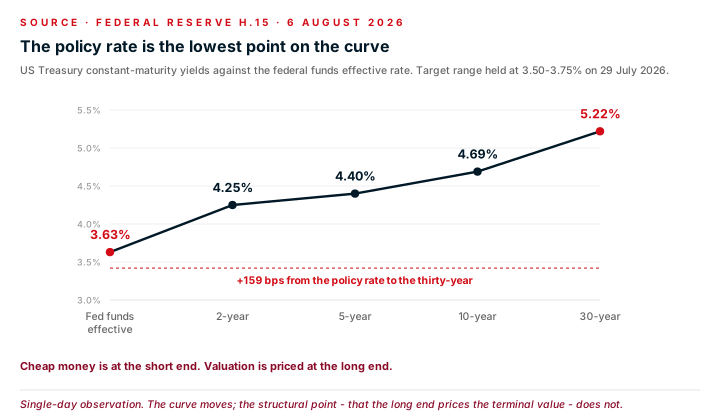
Why it matters: the two halves of a deal are now taking opposite signals from the same yield curve. The debt that funds an acquisition is priced off the short end, which has come down. The discount rate that values the business is anchored at the long end, which has gone up. A seller who reads only the policy rate will misjudge which direction the arithmetic is moving.
In April we asked what a 4% ten-year had done to private valuation math. Four months later the ten-year is 4.69% and the thirty-year is 5.22%, while the Federal Reserve's target range sits at 3.50–3.75% — held again on 29 July. The gap from the policy rate to the thirty-year is 159 basis points, and it runs the wrong way for anyone hoping the rate cycle would do their negotiating for them.
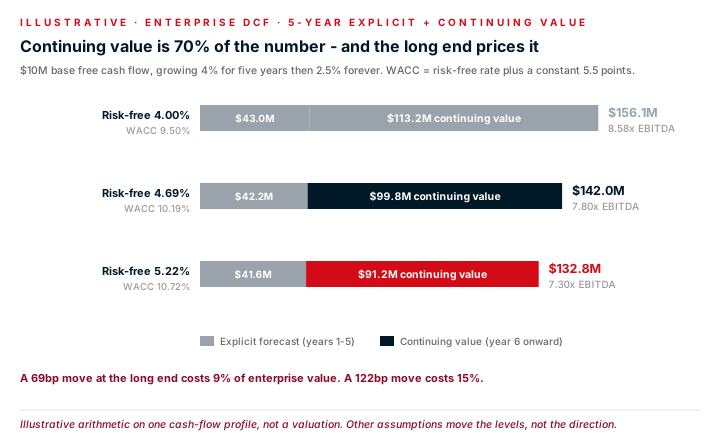
A discounted-cash-flow valuation of a mature business is mostly not a forecast. It is a perpetuity. Five years of explicit projections sit in front of a continuing value that carries everything after year five, and in a standard middle-market build that continuing value is roughly 70% of the total. The explicit period is where the diligence argument happens; the continuing value is where the money is.
Continuing value is a perpetuity, so the rate that prices it is the long end of the curve — not the overnight rate, and not the ten-year alone. Take a business generating $10M of free cash flow, growing 4% for five years and 2.5% thereafter, with a WACC built as the risk-free rate plus a constant 5.5 points. At a 4.00% anchor the enterprise value is $156.1M. At 4.69% it is $142.0M. At 5.22% it is $132.8M. The explicit period barely moves across all three — $43.0M to $41.6M. Continuing value falls from $113.2M to $91.2M and carries the entire difference.
Expressed as a multiple of the $18.2M of EBITDA implied by that cash flow, the same business prices at 8.58x, 7.80x, and 7.30x. The whole 1.3-turn spread comes from the far end of the curve, and none of it is a statement about the business.
Leverage is priced off the short end, and the short end has fallen. SOFR near 3.65% against a 2024 peak above 5.30% is a real change in what a buyer pays to hold the paper. On four turns of leverage against that same $18.2M of EBITDA — $72.8M of debt at SOFR plus 500 — annual interest falls from roughly $7.5M to $6.3M.
That is worth having, and it is not the same size as the other effect. The financing move saves about $1.2M a year. The discount-rate move costs $14M to $23M of enterprise value outright. A buyer whose cost of capital fell and whose valuation anchor rose is a buyer whose ability to pay and whose willingness to model have parted company — which is exactly the condition under which indications come in below where the seller expected, for reasons the seller cannot fix.
Three limits on this arithmetic. It is a single-day observation of a curve that moves; the levels here will be stale before the structural point is. The WACC build holds the equity risk premium constant at 5.5 points, which is a convenience, not a measurement — in practice premiums move with rates and sometimes offset them. And a middle-market business's real cost of capital is not a Treasury plus a constant; it carries size, illiquidity, and customer-concentration premiums that dwarf a 69-basis-point move in the risk-free rate.
What survives all three caveats is the direction and the location. Continuing value dominates the number, continuing value is priced at the long end, and the long end is where the move happened.
Do not read a softer indication as a verdict on the business. When the anchor moves 69 basis points, roughly 9% of enterprise value moves with it, and none of that is operational. The defended floor — hard-asset value, an independent appraisal, a deliberately conservative DCF — is the part of the frame that does not move with the curve, which is precisely why a seller should hold it as evidence rather than as an opening position.
What would change our view: a sustained rally at the long end, which would run this arithmetic in reverse and add back what the last four months took out. The near-term risk runs the other way. Futures markets have spent the summer pricing the odds of a hike rather than a cut, with energy-driven inflation the stated concern; the Committee next meets on 16 September. A seller weighing 2026 against 2027 should price the plateau that exists rather than the curve they would prefer.